Urban water systems provide critical services to meet the supply, sanitation, and drainage needs of urban societies. Evolving needs have resulted in increasingly expansive infrastructure, raising questions about the sustainability of such large infrastructure investments. In our recent paper in Urban Water Journal (link here, The evolution of urban water systems: Societal needs, institutional complexities, and resource costs), we gathered historical data over more than 150 years at the US national level to demonstrate how urban water services have evolved to meet increasing needs. We show how needs evolve hierarchically, with predictable outcomes in the form of service progression. We used a framework based on Maslow’s hierarchy of needs (Figure 1 below) to predict expected transitions in urban water services (Figure 2) with degree of societal development or complexity (which is also related to time, although likely non-linearly). The resulting data for urban water service transition in the United States from 1850 to 2010 supported our hypotheses (Figure 3). Finally, we also show, at the city scale, how this evolution of services results in increased institutional complexity and increased resource costs (Figure 4), but also providing tremendous benefits (Figure 5). Our paper closes with a thorough discuss of implications of continually increasing complexity for meeting future water needs.

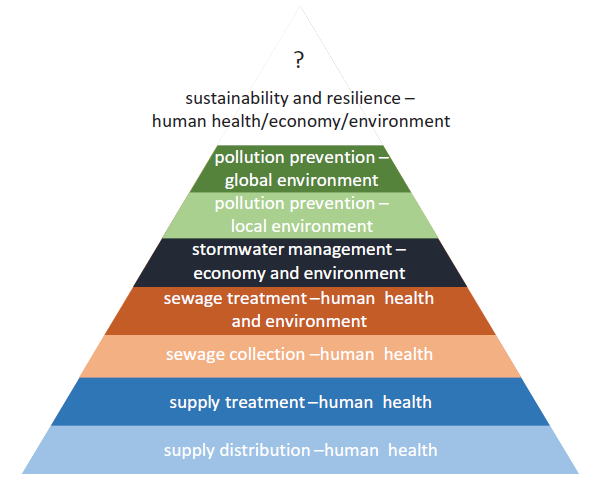
Figure 1. Urban water needs hierarchy adapted from the human needs model of Maslow (1943).

Figure 2. Hypothetical depiction of expected transitions in urban water services with degree of societal development or complexity. Societal effort allocated to individual services could be indicated by investment of labor, money, or resources. Note that the color scheme for the hypothesized sequence of services is maintained from Figure 1.

Figure 3. Evidence of urban water service transition in the United States from 1850 to 2010, with services corresponding to Figures 1 and 2.

Figure 4. Total annual resource (color plots) and monetary costs (grey lines) associated with the supply and sanitation sectors of the greater Cincinnati metropolitan area.

Figure 5. Resource costs of supply, sanitation, and drainage services alongside notable benefits (insets) in the greater Cincinnati metropolitan area